|
Download Data (XLS File) |
|
|||||
|
|||||
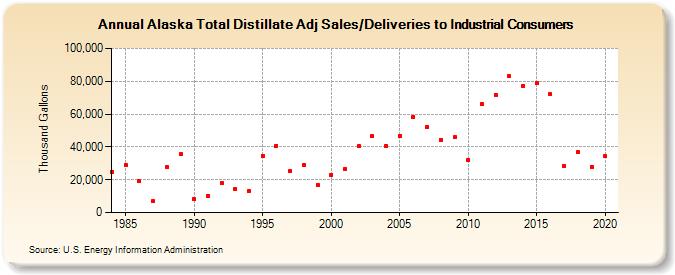
| Alaska Total Distillate Adj Sales/Deliveries to Industrial Consumers (Thousand Gallons) | |||||
| Decade | Year-0 | Year-1 | Year-2 | Year-3 | Year-4 | Year-5 | Year-6 | Year-7 | Year-8 | Year-9 |
|---|---|---|---|---|---|---|---|---|---|---|
| 1980's | 24,724 | 28,878 | 19,149 | 6,805 | 27,629 | 35,482 | ||||
| 1990's | 8,086 | 10,273 | 17,750 | 14,264 | 13,111 | 34,756 | 40,800 | 25,282 | 29,061 | 16,851 |
| 2000's | 23,135 | 26,654 | 40,335 | 46,629 | 40,702 | 46,908 | 58,227 | 52,245 | 44,341 | 45,778 |
| 2010's | 32,295 | 66,215 | 71,900 | 82,932 | 77,264 | 78,998 | 72,025 | 28,593 | 36,833 | 27,858 |
| 2020's | 34,290 |
| - = No Data Reported; -- = Not Applicable; NA = Not Available; W = Withheld to avoid disclosure of individual company data. |
| Release Date: 2/9/2022 |
| Next Release Date: Suspended |