|
Download Data (XLS File) |
|
|||||
|
|||||
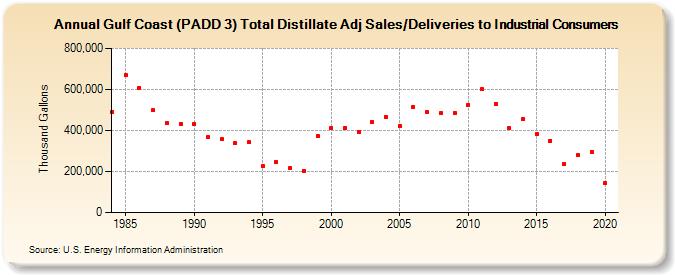
| Gulf Coast (PADD 3) Total Distillate Adj Sales/Deliveries to Industrial Consumers (Thousand Gallons) | |||||
| Decade | Year-0 | Year-1 | Year-2 | Year-3 | Year-4 | Year-5 | Year-6 | Year-7 | Year-8 | Year-9 |
|---|---|---|---|---|---|---|---|---|---|---|
| 1980's | 489,014 | 668,955 | 609,342 | 498,282 | 434,962 | 432,914 | ||||
| 1990's | 432,272 | 368,671 | 356,288 | 337,276 | 341,795 | 228,026 | 246,818 | 217,037 | 203,760 | 373,809 |
| 2000's | 411,730 | 414,085 | 392,048 | 441,469 | 466,636 | 421,231 | 516,119 | 487,916 | 484,576 | 486,499 |
| 2010's | 526,411 | 600,836 | 530,966 | 409,808 | 453,682 | 384,433 | 350,857 | 236,485 | 279,561 | 295,309 |
| 2020's | 143,515 |
| - = No Data Reported; -- = Not Applicable; NA = Not Available; W = Withheld to avoid disclosure of individual company data. |
| Release Date: 2/9/2022 |
| Next Release Date: Suspended |