|
Download Data (XLS File) |
|
|||||
|
|||||
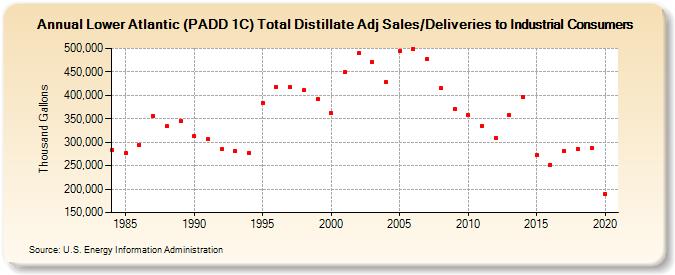
| Lower Atlantic (PADD 1C) Total Distillate Adj Sales/Deliveries to Industrial Consumers (Thousand Gallons) | |||||
| Decade | Year-0 | Year-1 | Year-2 | Year-3 | Year-4 | Year-5 | Year-6 | Year-7 | Year-8 | Year-9 |
|---|---|---|---|---|---|---|---|---|---|---|
| 1980's | 283,260 | 276,000 | 294,174 | 356,580 | 333,569 | 345,136 | ||||
| 1990's | 312,492 | 306,183 | 284,926 | 281,098 | 277,676 | 384,201 | 418,049 | 417,821 | 410,465 | 392,015 |
| 2000's | 361,801 | 449,617 | 489,397 | 470,560 | 429,147 | 494,928 | 498,812 | 477,655 | 415,481 | 370,129 |
| 2010's | 358,333 | 335,526 | 309,727 | 357,714 | 396,202 | 272,500 | 252,379 | 281,728 | 285,613 | 287,412 |
| 2020's | 189,648 |
| - = No Data Reported; -- = Not Applicable; NA = Not Available; W = Withheld to avoid disclosure of individual company data. |
| Release Date: 2/9/2022 |
| Next Release Date: Suspended |