|
Download Data (XLS File) |
|
|||||
|
|||||
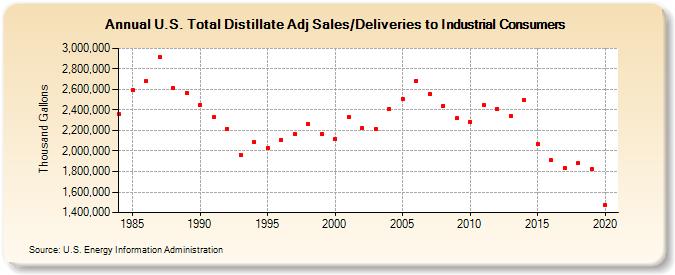
| U.S. Total Distillate Adj Sales/Deliveries to Industrial Consumers (Thousand Gallons) | |||||
| Decade | Year-0 | Year-1 | Year-2 | Year-3 | Year-4 | Year-5 | Year-6 | Year-7 | Year-8 | Year-9 |
|---|---|---|---|---|---|---|---|---|---|---|
| 1980's | 2,356,787 | 2,592,678 | 2,684,102 | 2,917,624 | 2,617,639 | 2,565,293 | ||||
| 1990's | 2,452,322 | 2,326,519 | 2,218,843 | 1,965,557 | 2,091,611 | 2,027,409 | 2,107,190 | 2,167,169 | 2,258,248 | 2,170,075 |
| 2000's | 2,117,531 | 2,329,029 | 2,223,793 | 2,216,222 | 2,411,204 | 2,506,975 | 2,684,735 | 2,553,933 | 2,442,708 | 2,318,682 |
| 2010's | 2,286,463 | 2,449,278 | 2,411,607 | 2,339,512 | 2,500,428 | 2,070,487 | 1,909,325 | 1,834,547 | 1,880,027 | 1,822,034 |
| 2020's | 1,471,229 |
| - = No Data Reported; -- = Not Applicable; NA = Not Available; W = Withheld to avoid disclosure of individual company data. |
| Release Date: 2/9/2022 |
| Next Release Date: Suspended |