|
Download Data (XLS File) |
|
|||||
|
|||||
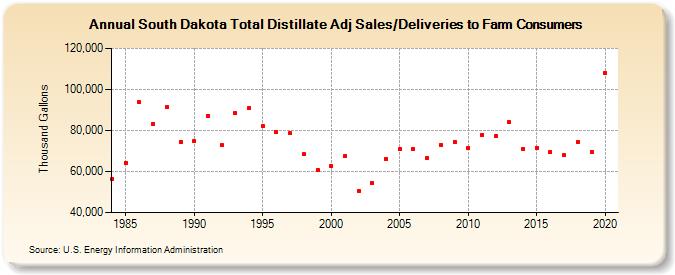
| South Dakota Total Distillate Adj Sales/Deliveries to Farm Consumers (Thousand Gallons) | |||||
| Decade | Year-0 | Year-1 | Year-2 | Year-3 | Year-4 | Year-5 | Year-6 | Year-7 | Year-8 | Year-9 |
|---|---|---|---|---|---|---|---|---|---|---|
| 1980's | 56,308 | 64,394 | 93,749 | 83,315 | 91,500 | 74,497 | ||||
| 1990's | 74,645 | 87,068 | 72,964 | 88,540 | 90,803 | 82,375 | 79,179 | 78,569 | 68,458 | 60,820 |
| 2000's | 62,656 | 67,370 | 50,568 | 54,431 | 66,221 | 70,874 | 70,873 | 66,408 | 73,086 | 74,560 |
| 2010's | 71,461 | 77,960 | 77,251 | 84,004 | 71,087 | 71,687 | 69,582 | 67,890 | 74,600 | 69,517 |
| 2020's | 108,188 |
| - = No Data Reported; -- = Not Applicable; NA = Not Available; W = Withheld to avoid disclosure of individual company data. |
| Release Date: 2/9/2022 |
| Next Release Date: Suspended |