|
Download Data (XLS File) |
|
|||||
|
|||||
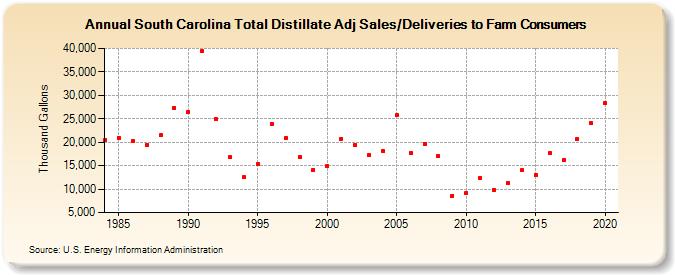
| South Carolina Total Distillate Adj Sales/Deliveries to Farm Consumers (Thousand Gallons) | |||||
| Decade | Year-0 | Year-1 | Year-2 | Year-3 | Year-4 | Year-5 | Year-6 | Year-7 | Year-8 | Year-9 |
|---|---|---|---|---|---|---|---|---|---|---|
| 1980's | 20,471 | 20,984 | 20,178 | 19,480 | 21,478 | 27,394 | ||||
| 1990's | 26,515 | 39,454 | 24,851 | 16,773 | 12,521 | 15,383 | 23,940 | 20,899 | 16,809 | 14,112 |
| 2000's | 14,906 | 20,756 | 19,408 | 17,216 | 18,078 | 25,706 | 17,717 | 19,704 | 17,049 | 8,637 |
| 2010's | 9,174 | 12,434 | 9,903 | 11,258 | 14,000 | 12,919 | 17,636 | 16,196 | 20,676 | 24,008 |
| 2020's | 28,258 |
| - = No Data Reported; -- = Not Applicable; NA = Not Available; W = Withheld to avoid disclosure of individual company data. |
| Release Date: 2/9/2022 |
| Next Release Date: Suspended |