|
Download Data (XLS File) |
|
|||||
|
|||||
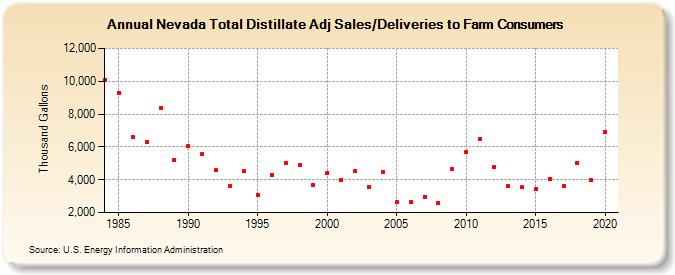
| Nevada Total Distillate Adj Sales/Deliveries to Farm Consumers (Thousand Gallons) | |||||
| Decade | Year-0 | Year-1 | Year-2 | Year-3 | Year-4 | Year-5 | Year-6 | Year-7 | Year-8 | Year-9 |
|---|---|---|---|---|---|---|---|---|---|---|
| 1980's | 10,083 | 9,289 | 6,612 | 6,304 | 8,360 | 5,187 | ||||
| 1990's | 6,067 | 5,565 | 4,570 | 3,640 | 4,513 | 3,089 | 4,260 | 5,049 | 4,903 | 3,653 |
| 2000's | 4,407 | 3,968 | 4,508 | 3,574 | 4,458 | 2,657 | 2,637 | 2,958 | 2,597 | 4,627 |
| 2010's | 5,672 | 6,494 | 4,766 | 3,648 | 3,545 | 3,425 | 4,018 | 3,623 | 5,046 | 3,959 |
| 2020's | 6,898 |
| - = No Data Reported; -- = Not Applicable; NA = Not Available; W = Withheld to avoid disclosure of individual company data. |
| Release Date: 2/9/2022 |
| Next Release Date: Suspended |