|
Download Data (XLS File) |
|
|||||
|
|||||
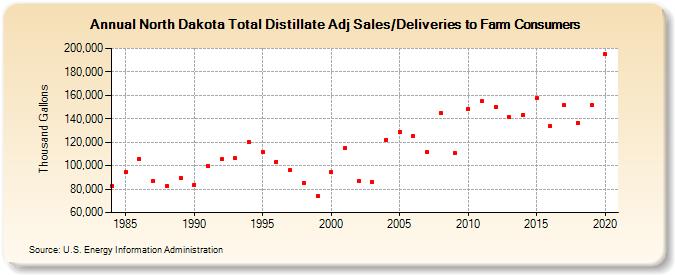
| North Dakota Total Distillate Adj Sales/Deliveries to Farm Consumers (Thousand Gallons) | |||||
| Decade | Year-0 | Year-1 | Year-2 | Year-3 | Year-4 | Year-5 | Year-6 | Year-7 | Year-8 | Year-9 |
|---|---|---|---|---|---|---|---|---|---|---|
| 1980's | 82,935 | 94,763 | 105,838 | 86,566 | 82,674 | 89,892 | ||||
| 1990's | 83,843 | 100,045 | 105,444 | 106,112 | 120,104 | 111,923 | 103,178 | 96,028 | 85,416 | 74,459 |
| 2000's | 94,570 | 114,784 | 86,523 | 86,322 | 121,962 | 128,940 | 125,182 | 111,538 | 145,100 | 111,167 |
| 2010's | 148,498 | 154,711 | 149,866 | 141,207 | 143,232 | 157,660 | 133,751 | 151,460 | 136,768 | 151,620 |
| 2020's | 194,938 |
| - = No Data Reported; -- = Not Applicable; NA = Not Available; W = Withheld to avoid disclosure of individual company data. |
| Release Date: 2/9/2022 |
| Next Release Date: Suspended |