|
Download Data (XLS File) |
|
|||||
|
|||||
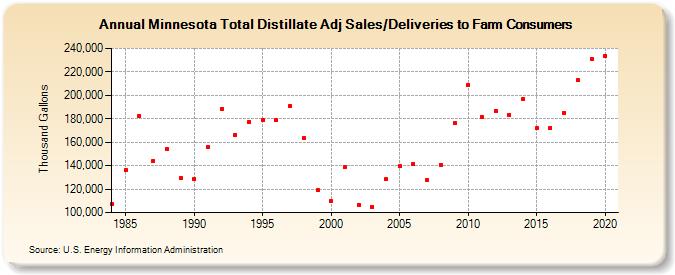
| Minnesota Total Distillate Adj Sales/Deliveries to Farm Consumers (Thousand Gallons) | |||||
| Decade | Year-0 | Year-1 | Year-2 | Year-3 | Year-4 | Year-5 | Year-6 | Year-7 | Year-8 | Year-9 |
|---|---|---|---|---|---|---|---|---|---|---|
| 1980's | 106,947 | 136,176 | 182,360 | 144,185 | 154,086 | 129,423 | ||||
| 1990's | 128,425 | 155,563 | 188,602 | 166,446 | 177,349 | 178,963 | 178,699 | 191,087 | 163,613 | 119,124 |
| 2000's | 109,759 | 138,671 | 106,529 | 105,155 | 128,354 | 139,485 | 141,197 | 127,452 | 140,579 | 176,369 |
| 2010's | 208,783 | 181,834 | 186,879 | 183,505 | 196,914 | 172,018 | 172,399 | 185,171 | 212,976 | 231,102 |
| 2020's | 233,604 |
| - = No Data Reported; -- = Not Applicable; NA = Not Available; W = Withheld to avoid disclosure of individual company data. |
| Release Date: 2/9/2022 |
| Next Release Date: Suspended |