|
Download Data (XLS File) |
|
|||||
|
|||||
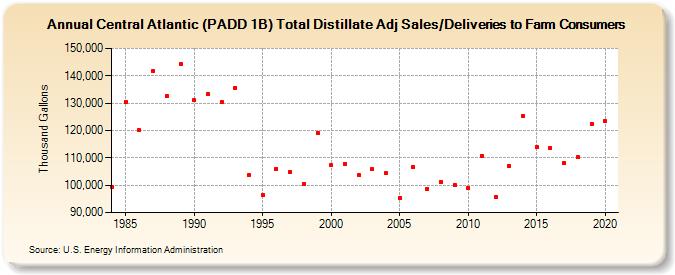
| Central Atlantic (PADD 1B) Total Distillate Adj Sales/Deliveries to Farm Consumers (Thousand Gallons) | |||||
| Decade | Year-0 | Year-1 | Year-2 | Year-3 | Year-4 | Year-5 | Year-6 | Year-7 | Year-8 | Year-9 |
|---|---|---|---|---|---|---|---|---|---|---|
| 1980's | 99,267 | 130,493 | 120,079 | 141,815 | 132,663 | 144,281 | ||||
| 1990's | 131,045 | 133,248 | 130,294 | 135,706 | 103,686 | 96,477 | 106,055 | 104,897 | 100,403 | 119,145 |
| 2000's | 107,222 | 107,779 | 103,583 | 105,960 | 104,343 | 95,422 | 106,726 | 98,751 | 101,175 | 100,179 |
| 2010's | 99,005 | 110,851 | 95,843 | 106,929 | 125,332 | 114,003 | 113,599 | 108,188 | 110,154 | 122,469 |
| 2020's | 123,349 |
| - = No Data Reported; -- = Not Applicable; NA = Not Available; W = Withheld to avoid disclosure of individual company data. |
| Release Date: 2/9/2022 |
| Next Release Date: Suspended |