|
Download Data (XLS File) |
|
|||||
|
|||||
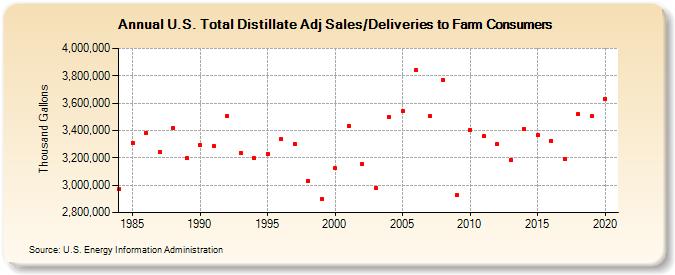
| U.S. Total Distillate Adj Sales/Deliveries to Farm Consumers (Thousand Gallons) | |||||
| Decade | Year-0 | Year-1 | Year-2 | Year-3 | Year-4 | Year-5 | Year-6 | Year-7 | Year-8 | Year-9 |
|---|---|---|---|---|---|---|---|---|---|---|
| 1980's | 2,974,418 | 3,311,309 | 3,380,046 | 3,241,968 | 3,420,671 | 3,196,928 | ||||
| 1990's | 3,293,792 | 3,285,639 | 3,504,846 | 3,238,675 | 3,198,640 | 3,230,765 | 3,334,420 | 3,304,531 | 3,033,405 | 2,899,222 |
| 2000's | 3,122,416 | 3,434,936 | 3,158,072 | 2,978,686 | 3,498,871 | 3,539,682 | 3,840,520 | 3,504,473 | 3,766,188 | 2,926,977 |
| 2010's | 3,404,509 | 3,357,509 | 3,300,430 | 3,183,058 | 3,413,859 | 3,366,091 | 3,325,080 | 3,190,657 | 3,516,800 | 3,503,645 |
| 2020's | 3,630,350 |
| - = No Data Reported; -- = Not Applicable; NA = Not Available; W = Withheld to avoid disclosure of individual company data. |
| Release Date: 2/9/2022 |
| Next Release Date: Suspended |