|
Download Data (XLS File) |
|
|||||
|
|||||
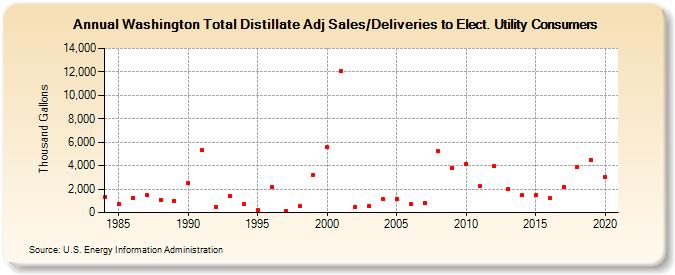
| Washington Total Distillate Adj Sales/Deliveries to Elect. Utility Consumers (Thousand Gallons) | |||||
| Decade | Year-0 | Year-1 | Year-2 | Year-3 | Year-4 | Year-5 | Year-6 | Year-7 | Year-8 | Year-9 |
|---|---|---|---|---|---|---|---|---|---|---|
| 1980's | 1,306 | 715 | 1,278 | 1,456 | 1,110 | 1,017 | ||||
| 1990's | 2,531 | 5,310 | 467 | 1,411 | 700 | 221 | 2,162 | 159 | 519 | 3,213 |
| 2000's | 5,595 | 12,045 | 513 | 519 | 1,154 | 1,171 | 703 | 805 | 5,224 | 3,805 |
| 2010's | 4,182 | 2,256 | 3,936 | 1,971 | 1,473 | 1,463 | 1,218 | 2,190 | 3,898 | 4,489 |
| 2020's | 3,021 |
| - = No Data Reported; -- = Not Applicable; NA = Not Available; W = Withheld to avoid disclosure of individual company data. |
| Release Date: 2/9/2022 |
| Next Release Date: Suspended |