|
Download Data (XLS File) |
|
|||||
|
|||||
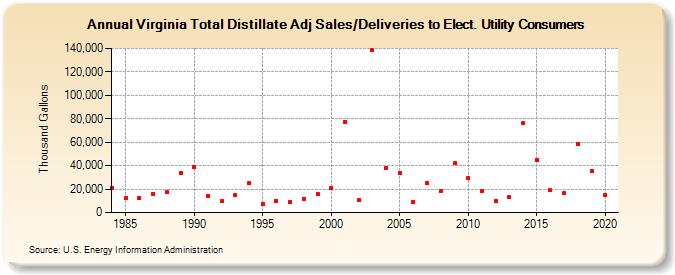
| Virginia Total Distillate Adj Sales/Deliveries to Elect. Utility Consumers (Thousand Gallons) | |||||
| Decade | Year-0 | Year-1 | Year-2 | Year-3 | Year-4 | Year-5 | Year-6 | Year-7 | Year-8 | Year-9 |
|---|---|---|---|---|---|---|---|---|---|---|
| 1980's | 20,735 | 12,322 | 12,520 | 16,091 | 17,231 | 33,892 | ||||
| 1990's | 38,813 | 14,527 | 10,214 | 14,756 | 24,980 | 7,276 | 10,225 | 9,082 | 11,657 | 16,189 |
| 2000's | 20,683 | 77,582 | 10,818 | 138,569 | 37,983 | 33,450 | 9,296 | 24,851 | 18,675 | 41,945 |
| 2010's | 29,263 | 18,394 | 10,178 | 12,927 | 76,003 | 45,047 | 18,846 | 16,586 | 58,685 | 35,090 |
| 2020's | 14,581 |
| - = No Data Reported; -- = Not Applicable; NA = Not Available; W = Withheld to avoid disclosure of individual company data. |
| Release Date: 2/9/2022 |
| Next Release Date: Suspended |