|
Download Data (XLS File) |
|
|||||
|
|||||
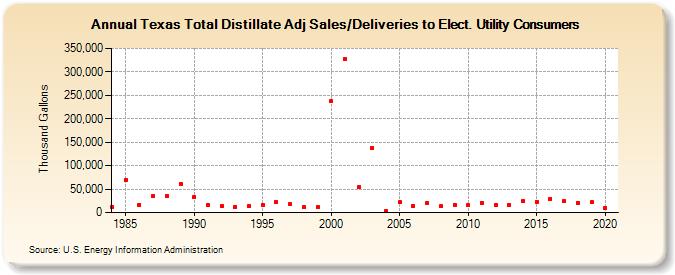
| Texas Total Distillate Adj Sales/Deliveries to Elect. Utility Consumers (Thousand Gallons) | |||||
| Decade | Year-0 | Year-1 | Year-2 | Year-3 | Year-4 | Year-5 | Year-6 | Year-7 | Year-8 | Year-9 |
|---|---|---|---|---|---|---|---|---|---|---|
| 1980's | 11,672 | 70,247 | 17,173 | 34,322 | 35,245 | 61,532 | ||||
| 1990's | 33,443 | 15,674 | 14,896 | 12,615 | 13,689 | 16,404 | 22,088 | 17,588 | 11,222 | 11,988 |
| 2000's | 237,751 | 327,665 | 54,948 | 137,924 | 3,350 | 21,458 | 14,679 | 21,005 | 13,098 | 17,125 |
| 2010's | 15,181 | 20,946 | 16,147 | 16,765 | 23,837 | 23,132 | 29,454 | 24,389 | 21,062 | 22,082 |
| 2020's | 10,765 |
| - = No Data Reported; -- = Not Applicable; NA = Not Available; W = Withheld to avoid disclosure of individual company data. |
| Release Date: 2/9/2022 |
| Next Release Date: Suspended |