|
Download Data (XLS File) |
|
|||||
|
|||||
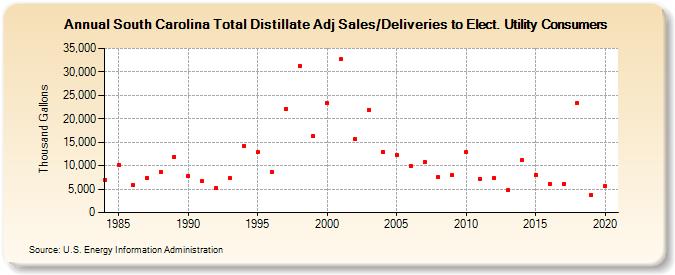
| South Carolina Total Distillate Adj Sales/Deliveries to Elect. Utility Consumers (Thousand Gallons) | |||||
| Decade | Year-0 | Year-1 | Year-2 | Year-3 | Year-4 | Year-5 | Year-6 | Year-7 | Year-8 | Year-9 |
|---|---|---|---|---|---|---|---|---|---|---|
| 1980's | 7,012 | 10,061 | 5,839 | 7,437 | 8,692 | 11,880 | ||||
| 1990's | 7,896 | 6,626 | 5,316 | 7,354 | 14,161 | 12,822 | 8,700 | 22,165 | 31,220 | 16,271 |
| 2000's | 23,337 | 32,649 | 15,580 | 21,966 | 12,997 | 12,239 | 9,982 | 10,735 | 7,507 | 7,906 |
| 2010's | 12,851 | 7,222 | 7,382 | 4,735 | 11,182 | 8,091 | 6,161 | 6,151 | 23,321 | 3,735 |
| 2020's | 5,651 |
| - = No Data Reported; -- = Not Applicable; NA = Not Available; W = Withheld to avoid disclosure of individual company data. |
| Release Date: 2/9/2022 |
| Next Release Date: Suspended |