|
Download Data (XLS File) |
|
|||||
|
|||||
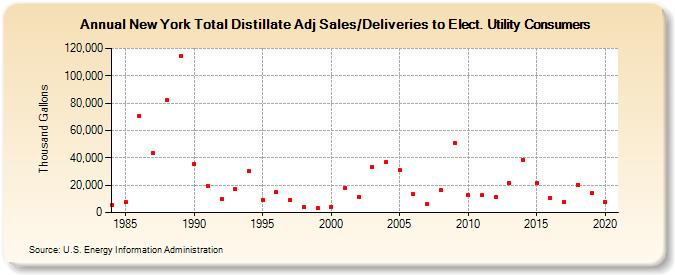
| New York Total Distillate Adj Sales/Deliveries to Elect. Utility Consumers (Thousand Gallons) | |||||
| Decade | Year-0 | Year-1 | Year-2 | Year-3 | Year-4 | Year-5 | Year-6 | Year-7 | Year-8 | Year-9 |
|---|---|---|---|---|---|---|---|---|---|---|
| 1980's | 5,604 | 7,496 | 70,469 | 43,499 | 81,982 | 114,115 | ||||
| 1990's | 35,683 | 19,459 | 9,911 | 16,897 | 30,168 | 9,260 | 14,873 | 9,464 | 3,789 | 3,047 |
| 2000's | 4,325 | 18,261 | 11,255 | 33,352 | 36,996 | 30,937 | 13,559 | 6,207 | 16,218 | 50,533 |
| 2010's | 12,634 | 12,533 | 11,028 | 21,732 | 38,703 | 21,738 | 10,879 | 7,924 | 20,426 | 14,258 |
| 2020's | 7,781 |
| - = No Data Reported; -- = Not Applicable; NA = Not Available; W = Withheld to avoid disclosure of individual company data. |
| Release Date: 2/9/2022 |
| Next Release Date: Suspended |