|
Download Data (XLS File) |
|
|||||
|
|||||
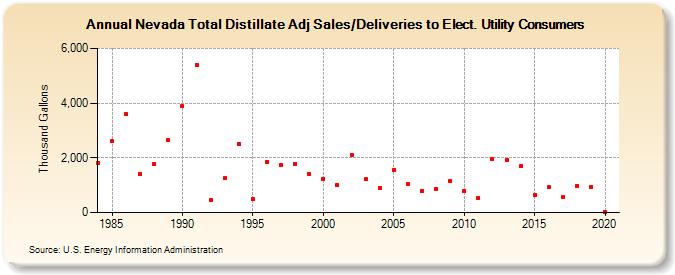
| Nevada Total Distillate Adj Sales/Deliveries to Elect. Utility Consumers (Thousand Gallons) | |||||
| Decade | Year-0 | Year-1 | Year-2 | Year-3 | Year-4 | Year-5 | Year-6 | Year-7 | Year-8 | Year-9 |
|---|---|---|---|---|---|---|---|---|---|---|
| 1980's | 1,828 | 2,604 | 3,613 | 1,415 | 1,768 | 2,639 | ||||
| 1990's | 3,881 | 5,405 | 467 | 1,259 | 2,520 | 504 | 1,864 | 1,738 | 1,787 | 1,399 |
| 2000's | 1,231 | 1,020 | 2,105 | 1,216 | 896 | 1,565 | 1,040 | 799 | 877 | 1,144 |
| 2010's | 771 | 541 | 1,957 | 1,916 | 1,689 | 640 | 919 | 553 | 984 | 930 |
| 2020's | 14 |
| - = No Data Reported; -- = Not Applicable; NA = Not Available; W = Withheld to avoid disclosure of individual company data. |
| Release Date: 2/9/2022 |
| Next Release Date: Suspended |