|
Download Data (XLS File) |
|
|||||
|
|||||
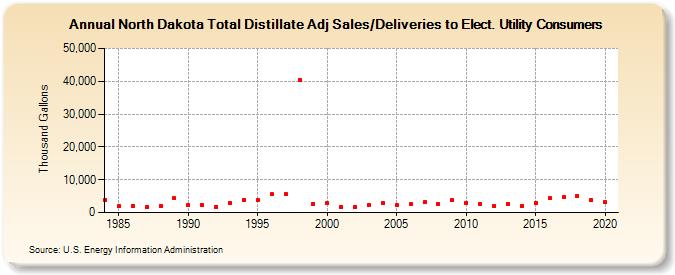
| North Dakota Total Distillate Adj Sales/Deliveries to Elect. Utility Consumers (Thousand Gallons) | |||||
| Decade | Year-0 | Year-1 | Year-2 | Year-3 | Year-4 | Year-5 | Year-6 | Year-7 | Year-8 | Year-9 |
|---|---|---|---|---|---|---|---|---|---|---|
| 1980's | 3,834 | 1,937 | 2,055 | 1,713 | 1,999 | 4,302 | ||||
| 1990's | 2,194 | 2,229 | 1,774 | 2,983 | 3,939 | 3,969 | 5,506 | 5,533 | 40,327 | 2,726 |
| 2000's | 2,775 | 1,718 | 1,704 | 2,168 | 2,762 | 2,282 | 2,467 | 3,181 | 2,677 | 3,806 |
| 2010's | 2,933 | 2,616 | 2,001 | 2,596 | 2,055 | 2,911 | 4,342 | 4,731 | 4,975 | 3,756 |
| 2020's | 3,122 |
| - = No Data Reported; -- = Not Applicable; NA = Not Available; W = Withheld to avoid disclosure of individual company data. |
| Release Date: 2/9/2022 |
| Next Release Date: Suspended |