|
Download Data (XLS File) |
|
|||||
|
|||||
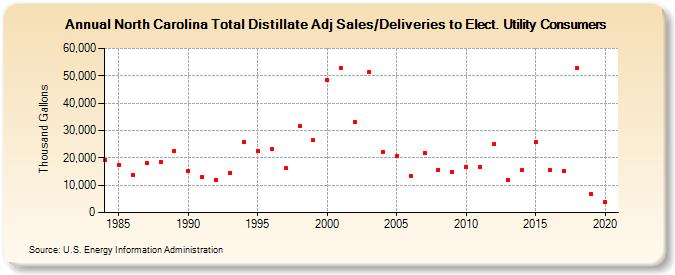
| North Carolina Total Distillate Adj Sales/Deliveries to Elect. Utility Consumers (Thousand Gallons) | |||||
| Decade | Year-0 | Year-1 | Year-2 | Year-3 | Year-4 | Year-5 | Year-6 | Year-7 | Year-8 | Year-9 |
|---|---|---|---|---|---|---|---|---|---|---|
| 1980's | 19,131 | 17,452 | 13,821 | 18,118 | 18,434 | 22,419 | ||||
| 1990's | 15,224 | 13,102 | 11,944 | 14,603 | 25,797 | 22,491 | 23,354 | 16,213 | 31,541 | 26,385 |
| 2000's | 48,417 | 52,671 | 33,074 | 51,467 | 22,237 | 20,669 | 13,401 | 21,885 | 15,659 | 14,904 |
| 2010's | 16,755 | 16,789 | 25,140 | 11,908 | 15,557 | 25,781 | 15,534 | 15,333 | 52,709 | 6,756 |
| 2020's | 3,850 |
| - = No Data Reported; -- = Not Applicable; NA = Not Available; W = Withheld to avoid disclosure of individual company data. |
| Release Date: 2/9/2022 |
| Next Release Date: Suspended |