|
Download Data (XLS File) |
|
|||||
|
|||||
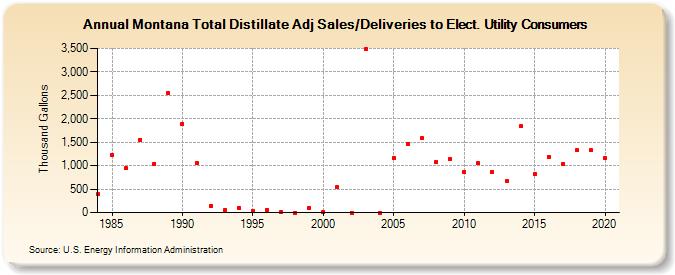
| Montana Total Distillate Adj Sales/Deliveries to Elect. Utility Consumers (Thousand Gallons) | |||||
| Decade | Year-0 | Year-1 | Year-2 | Year-3 | Year-4 | Year-5 | Year-6 | Year-7 | Year-8 | Year-9 |
|---|---|---|---|---|---|---|---|---|---|---|
| 1980's | 392 | 1,225 | 944 | 1,549 | 1,043 | 2,552 | ||||
| 1990's | 1,896 | 1,056 | 137 | 53 | 105 | 38 | 65 | 15 | 0 | 105 |
| 2000's | 19 | 538 | 0 | 3,485 | 0 | 1,168 | 1,467 | 1,579 | 1,069 | 1,143 |
| 2010's | 865 | 1,048 | 865 | 665 | 1,838 | 823 | 1,191 | 1,038 | 1,324 | 1,325 |
| 2020's | 1,161 |
| - = No Data Reported; -- = Not Applicable; NA = Not Available; W = Withheld to avoid disclosure of individual company data. |
| Release Date: 2/9/2022 |
| Next Release Date: Suspended |