|
Download Data (XLS File) |
|
|||||
|
|||||
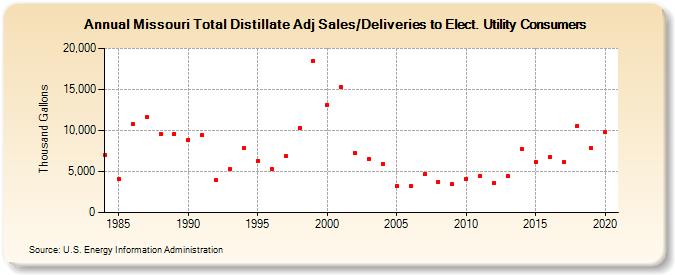
| Missouri Total Distillate Adj Sales/Deliveries to Elect. Utility Consumers (Thousand Gallons) | |||||
| Decade | Year-0 | Year-1 | Year-2 | Year-3 | Year-4 | Year-5 | Year-6 | Year-7 | Year-8 | Year-9 |
|---|---|---|---|---|---|---|---|---|---|---|
| 1980's | 7,014 | 4,074 | 10,758 | 11,601 | 9,594 | 9,620 | ||||
| 1990's | 8,872 | 9,415 | 3,914 | 5,291 | 7,820 | 6,332 | 5,307 | 6,847 | 10,318 | 18,483 |
| 2000's | 13,154 | 15,249 | 7,271 | 6,532 | 5,923 | 3,253 | 3,202 | 4,664 | 3,783 | 3,423 |
| 2010's | 4,139 | 4,486 | 3,637 | 4,396 | 7,728 | 6,191 | 6,755 | 6,146 | 10,561 | 7,846 |
| 2020's | 9,803 |
| - = No Data Reported; -- = Not Applicable; NA = Not Available; W = Withheld to avoid disclosure of individual company data. |
| Release Date: 2/9/2022 |
| Next Release Date: Suspended |