|
Download Data (XLS File) |
|
|||||
|
|||||
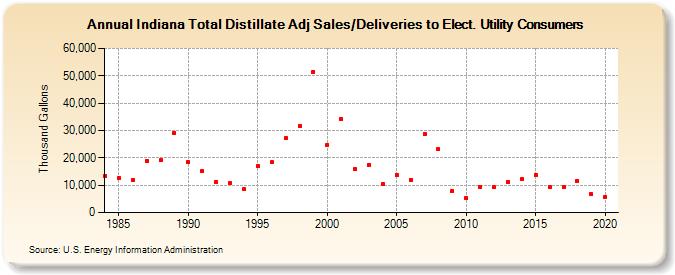
| Indiana Total Distillate Adj Sales/Deliveries to Elect. Utility Consumers (Thousand Gallons) | |||||
| Decade | Year-0 | Year-1 | Year-2 | Year-3 | Year-4 | Year-5 | Year-6 | Year-7 | Year-8 | Year-9 |
|---|---|---|---|---|---|---|---|---|---|---|
| 1980's | 13,464 | 12,656 | 11,895 | 18,922 | 19,048 | 29,115 | ||||
| 1990's | 18,467 | 15,178 | 11,248 | 10,735 | 8,443 | 16,944 | 18,371 | 27,206 | 31,547 | 51,543 |
| 2000's | 24,870 | 34,328 | 15,793 | 17,492 | 10,407 | 13,841 | 12,082 | 28,776 | 23,051 | 7,898 |
| 2010's | 5,262 | 9,387 | 9,228 | 11,227 | 12,191 | 13,903 | 9,331 | 9,235 | 11,447 | 6,759 |
| 2020's | 5,812 |
| - = No Data Reported; -- = Not Applicable; NA = Not Available; W = Withheld to avoid disclosure of individual company data. |
| Release Date: 2/9/2022 |
| Next Release Date: Suspended |