|
Download Data (XLS File) |
|
|||||
|
|||||
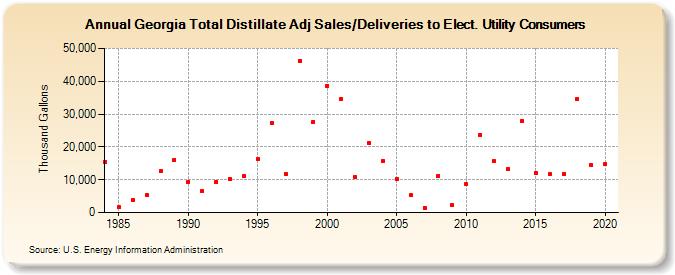
| Georgia Total Distillate Adj Sales/Deliveries to Elect. Utility Consumers (Thousand Gallons) | |||||
| Decade | Year-0 | Year-1 | Year-2 | Year-3 | Year-4 | Year-5 | Year-6 | Year-7 | Year-8 | Year-9 |
|---|---|---|---|---|---|---|---|---|---|---|
| 1980's | 15,506 | 1,612 | 3,927 | 5,382 | 12,510 | 16,155 | ||||
| 1990's | 9,431 | 6,595 | 9,394 | 10,202 | 11,106 | 16,371 | 27,265 | 11,884 | 46,246 | 27,675 |
| 2000's | 38,684 | 34,686 | 10,875 | 21,335 | 15,838 | 10,244 | 5,318 | 1,533 | 11,278 | 2,206 |
| 2010's | 8,550 | 23,679 | 15,655 | 13,318 | 27,896 | 12,191 | 11,611 | 11,779 | 34,612 | 14,457 |
| 2020's | 14,737 |
| - = No Data Reported; -- = Not Applicable; NA = Not Available; W = Withheld to avoid disclosure of individual company data. |
| Release Date: 2/9/2022 |
| Next Release Date: Suspended |