|
Download Data (XLS File) |
|
|||||
|
|||||
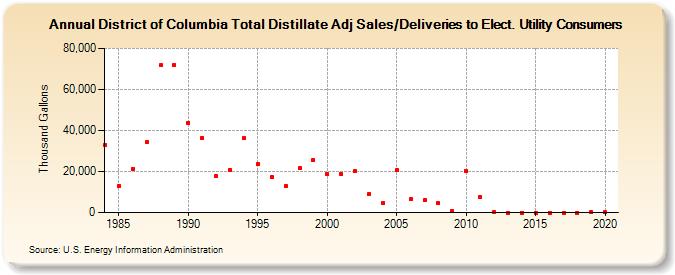
| District of Columbia Total Distillate Adj Sales/Deliveries to Elect. Utility Consumers (Thousand Gallons) | |||||
| Decade | Year-0 | Year-1 | Year-2 | Year-3 | Year-4 | Year-5 | Year-6 | Year-7 | Year-8 | Year-9 |
|---|---|---|---|---|---|---|---|---|---|---|
| 1980's | 33,121 | 12,975 | 21,385 | 34,230 | 71,720 | 71,970 | ||||
| 1990's | 43,677 | 36,517 | 17,614 | 20,812 | 36,208 | 23,714 | 17,252 | 13,001 | 21,553 | 25,565 |
| 2000's | 18,584 | 18,847 | 20,251 | 9,013 | 4,792 | 20,592 | 6,447 | 5,985 | 4,579 | 793 |
| 2010's | 20,185 | 7,722 | 266 | 0 | 0 | 0 | 0 | 0 | 7 | 124 |
| 2020's | 128 |
| - = No Data Reported; -- = Not Applicable; NA = Not Available; W = Withheld to avoid disclosure of individual company data. |
| Release Date: 2/9/2022 |
| Next Release Date: Suspended |