|
Download Data (XLS File) |
|
|||||
|
|||||
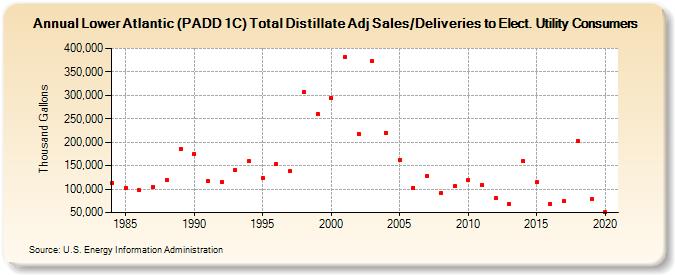
| Lower Atlantic (PADD 1C) Total Distillate Adj Sales/Deliveries to Elect. Utility Consumers (Thousand Gallons) | |||||
| Decade | Year-0 | Year-1 | Year-2 | Year-3 | Year-4 | Year-5 | Year-6 | Year-7 | Year-8 | Year-9 |
|---|---|---|---|---|---|---|---|---|---|---|
| 1980's | 112,978 | 102,864 | 97,353 | 105,470 | 119,238 | 186,446 | ||||
| 1990's | 174,972 | 117,165 | 115,334 | 140,859 | 158,895 | 124,035 | 152,703 | 137,877 | 307,126 | 260,922 |
| 2000's | 295,184 | 382,689 | 218,323 | 372,247 | 220,549 | 162,569 | 103,419 | 128,739 | 90,641 | 105,948 |
| 2010's | 118,474 | 109,739 | 80,332 | 68,523 | 159,125 | 114,143 | 68,815 | 74,891 | 202,880 | 78,128 |
| 2020's | 51,765 |
| - = No Data Reported; -- = Not Applicable; NA = Not Available; W = Withheld to avoid disclosure of individual company data. |
| Release Date: 2/9/2022 |
| Next Release Date: Suspended |