|
Download Data (XLS File) |
|
|||||
|
|||||
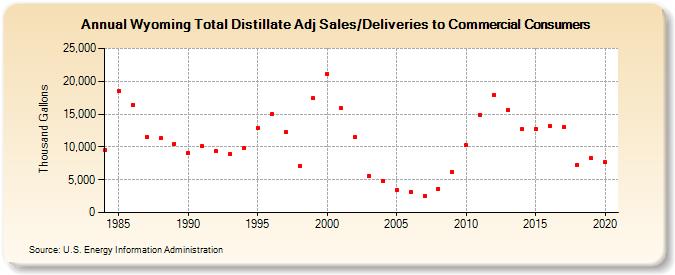
| Wyoming Total Distillate Adj Sales/Deliveries to Commercial Consumers (Thousand Gallons) | |||||
| Decade | Year-0 | Year-1 | Year-2 | Year-3 | Year-4 | Year-5 | Year-6 | Year-7 | Year-8 | Year-9 |
|---|---|---|---|---|---|---|---|---|---|---|
| 1980's | 9,518 | 18,508 | 16,418 | 11,472 | 11,315 | 10,479 | ||||
| 1990's | 9,048 | 10,091 | 9,316 | 8,978 | 9,756 | 12,924 | 14,958 | 12,254 | 7,067 | 17,398 |
| 2000's | 21,112 | 15,869 | 11,436 | 5,640 | 4,876 | 3,371 | 3,148 | 2,516 | 3,617 | 6,140 |
| 2010's | 10,231 | 14,904 | 17,975 | 15,584 | 12,672 | 12,689 | 13,222 | 13,063 | 7,221 | 8,273 |
| 2020's | 7,655 |
| - = No Data Reported; -- = Not Applicable; NA = Not Available; W = Withheld to avoid disclosure of individual company data. |
| Release Date: 2/9/2022 |
| Next Release Date: Suspended |