|
Download Data (XLS File) |
|
|||||
|
|||||
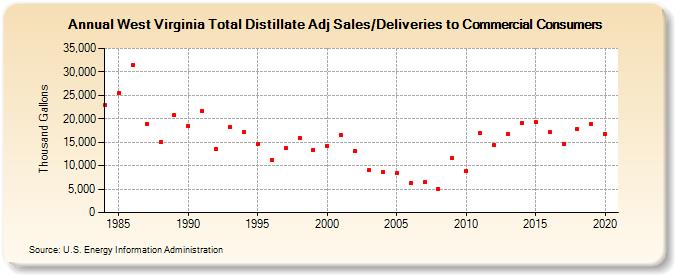
| West Virginia Total Distillate Adj Sales/Deliveries to Commercial Consumers (Thousand Gallons) | |||||
| Decade | Year-0 | Year-1 | Year-2 | Year-3 | Year-4 | Year-5 | Year-6 | Year-7 | Year-8 | Year-9 |
|---|---|---|---|---|---|---|---|---|---|---|
| 1980's | 22,894 | 25,398 | 31,480 | 18,922 | 15,011 | 20,776 | ||||
| 1990's | 18,545 | 21,709 | 13,511 | 18,328 | 17,125 | 14,523 | 11,234 | 13,684 | 15,849 | 13,419 |
| 2000's | 14,268 | 16,441 | 13,073 | 9,032 | 8,604 | 8,435 | 6,200 | 6,450 | 4,987 | 11,599 |
| 2010's | 8,810 | 16,972 | 14,375 | 16,767 | 19,188 | 19,337 | 17,146 | 14,707 | 17,751 | 18,876 |
| 2020's | 16,682 |
| - = No Data Reported; -- = Not Applicable; NA = Not Available; W = Withheld to avoid disclosure of individual company data. |
| Release Date: 2/9/2022 |
| Next Release Date: Suspended |