|
Download Data (XLS File) |
|
|||||
|
|||||
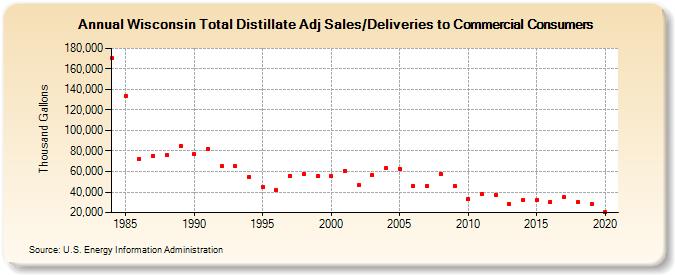
| Wisconsin Total Distillate Adj Sales/Deliveries to Commercial Consumers (Thousand Gallons) | |||||
| Decade | Year-0 | Year-1 | Year-2 | Year-3 | Year-4 | Year-5 | Year-6 | Year-7 | Year-8 | Year-9 |
|---|---|---|---|---|---|---|---|---|---|---|
| 1980's | 170,309 | 133,536 | 72,527 | 75,446 | 75,758 | 84,664 | ||||
| 1990's | 76,744 | 82,282 | 65,177 | 64,913 | 54,756 | 44,635 | 41,657 | 55,918 | 57,267 | 55,341 |
| 2000's | 55,197 | 60,896 | 46,598 | 56,409 | 63,469 | 62,718 | 45,718 | 45,842 | 57,598 | 45,709 |
| 2010's | 32,999 | 37,821 | 37,526 | 28,710 | 32,522 | 31,819 | 30,614 | 34,712 | 30,100 | 28,584 |
| 2020's | 20,923 |
| - = No Data Reported; -- = Not Applicable; NA = Not Available; W = Withheld to avoid disclosure of individual company data. |
| Release Date: 2/9/2022 |
| Next Release Date: Suspended |