|
Download Data (XLS File) |
|
|||||
|
|||||
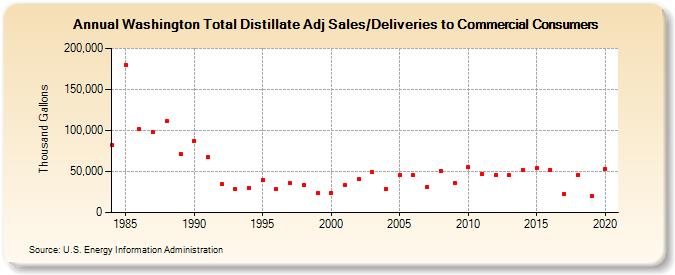
| Washington Total Distillate Adj Sales/Deliveries to Commercial Consumers (Thousand Gallons) | |||||
| Decade | Year-0 | Year-1 | Year-2 | Year-3 | Year-4 | Year-5 | Year-6 | Year-7 | Year-8 | Year-9 |
|---|---|---|---|---|---|---|---|---|---|---|
| 1980's | 81,821 | 179,853 | 101,559 | 97,895 | 111,008 | 71,707 | ||||
| 1990's | 87,562 | 67,622 | 34,275 | 28,339 | 30,243 | 39,205 | 28,295 | 35,881 | 33,142 | 23,615 |
| 2000's | 24,330 | 33,512 | 41,099 | 49,097 | 28,639 | 45,584 | 45,402 | 31,498 | 51,065 | 35,852 |
| 2010's | 55,121 | 47,310 | 45,530 | 45,433 | 51,671 | 54,019 | 51,615 | 22,597 | 45,564 | 20,342 |
| 2020's | 53,204 |
| - = No Data Reported; -- = Not Applicable; NA = Not Available; W = Withheld to avoid disclosure of individual company data. |
| Release Date: 2/9/2022 |
| Next Release Date: Suspended |