|
Download Data (XLS File) |
|
|||||
|
|||||
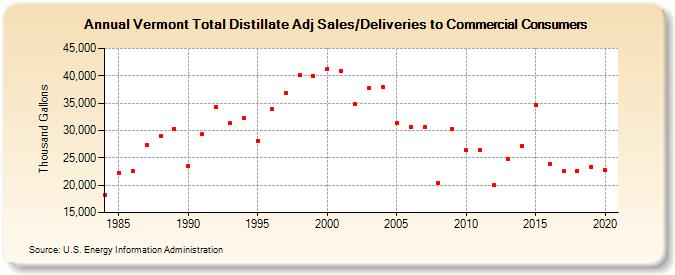
| Vermont Total Distillate Adj Sales/Deliveries to Commercial Consumers (Thousand Gallons) | |||||
| Decade | Year-0 | Year-1 | Year-2 | Year-3 | Year-4 | Year-5 | Year-6 | Year-7 | Year-8 | Year-9 |
|---|---|---|---|---|---|---|---|---|---|---|
| 1980's | 18,192 | 22,295 | 22,567 | 27,382 | 29,000 | 30,329 | ||||
| 1990's | 23,590 | 29,389 | 34,272 | 31,317 | 32,282 | 28,162 | 33,904 | 36,811 | 40,144 | 39,929 |
| 2000's | 41,215 | 40,862 | 34,755 | 37,706 | 37,877 | 31,403 | 30,629 | 30,559 | 20,483 | 30,180 |
| 2010's | 26,410 | 26,372 | 20,031 | 24,735 | 27,230 | 34,639 | 23,784 | 22,538 | 22,668 | 23,344 |
| 2020's | 22,767 |
| - = No Data Reported; -- = Not Applicable; NA = Not Available; W = Withheld to avoid disclosure of individual company data. |
| Release Date: 2/9/2022 |
| Next Release Date: Suspended |