|
Download Data (XLS File) |
|
|||||
|
|||||
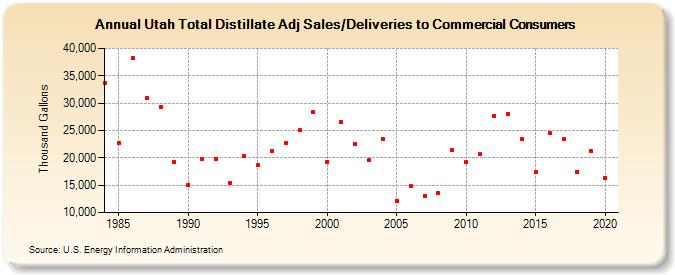
| Utah Total Distillate Adj Sales/Deliveries to Commercial Consumers (Thousand Gallons) | |||||
| Decade | Year-0 | Year-1 | Year-2 | Year-3 | Year-4 | Year-5 | Year-6 | Year-7 | Year-8 | Year-9 |
|---|---|---|---|---|---|---|---|---|---|---|
| 1980's | 33,675 | 22,758 | 38,221 | 30,925 | 29,284 | 19,280 | ||||
| 1990's | 15,093 | 19,702 | 19,742 | 15,361 | 20,296 | 18,615 | 21,193 | 22,654 | 25,077 | 28,288 |
| 2000's | 19,301 | 26,588 | 22,555 | 19,543 | 23,417 | 12,124 | 14,823 | 13,092 | 13,549 | 21,459 |
| 2010's | 19,159 | 20,649 | 27,705 | 27,928 | 23,354 | 17,444 | 24,503 | 23,382 | 17,468 | 21,283 |
| 2020's | 16,398 |
| - = No Data Reported; -- = Not Applicable; NA = Not Available; W = Withheld to avoid disclosure of individual company data. |
| Release Date: 2/9/2022 |
| Next Release Date: Suspended |