|
Download Data (XLS File) |
|
|||||
|
|||||
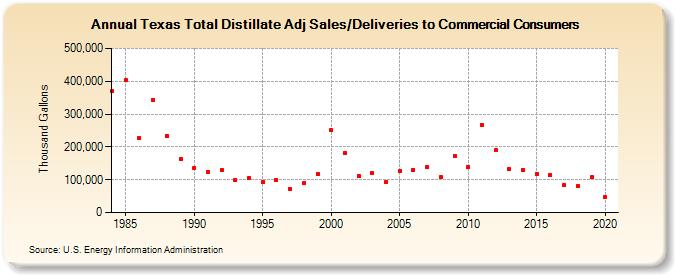
| Texas Total Distillate Adj Sales/Deliveries to Commercial Consumers (Thousand Gallons) | |||||
| Decade | Year-0 | Year-1 | Year-2 | Year-3 | Year-4 | Year-5 | Year-6 | Year-7 | Year-8 | Year-9 |
|---|---|---|---|---|---|---|---|---|---|---|
| 1980's | 368,799 | 403,367 | 227,237 | 343,872 | 234,553 | 163,537 | ||||
| 1990's | 137,161 | 123,854 | 130,395 | 98,315 | 105,844 | 92,796 | 98,844 | 72,220 | 88,545 | 117,711 |
| 2000's | 251,230 | 180,392 | 111,239 | 119,591 | 93,570 | 125,456 | 131,009 | 137,328 | 109,009 | 171,726 |
| 2010's | 139,025 | 266,691 | 190,340 | 132,521 | 130,872 | 117,669 | 113,898 | 84,589 | 81,626 | 106,826 |
| 2020's | 46,484 |
| - = No Data Reported; -- = Not Applicable; NA = Not Available; W = Withheld to avoid disclosure of individual company data. |
| Release Date: 2/9/2022 |
| Next Release Date: Suspended |