|
Download Data (XLS File) |
|
|||||
|
|||||
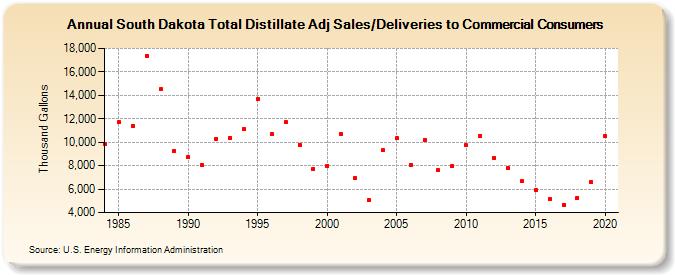
| South Dakota Total Distillate Adj Sales/Deliveries to Commercial Consumers (Thousand Gallons) | |||||
| Decade | Year-0 | Year-1 | Year-2 | Year-3 | Year-4 | Year-5 | Year-6 | Year-7 | Year-8 | Year-9 |
|---|---|---|---|---|---|---|---|---|---|---|
| 1980's | 9,870 | 11,692 | 11,378 | 17,378 | 14,495 | 9,253 | ||||
| 1990's | 8,718 | 8,045 | 10,310 | 10,394 | 11,141 | 13,674 | 10,679 | 11,693 | 9,802 | 7,728 |
| 2000's | 8,000 | 10,677 | 6,914 | 5,056 | 9,297 | 10,321 | 8,071 | 10,213 | 7,587 | 7,956 |
| 2010's | 9,736 | 10,538 | 8,687 | 7,799 | 6,656 | 5,930 | 5,164 | 4,687 | 5,282 | 6,596 |
| 2020's | 10,525 |
| - = No Data Reported; -- = Not Applicable; NA = Not Available; W = Withheld to avoid disclosure of individual company data. |
| Release Date: 2/9/2022 |
| Next Release Date: Suspended |