|
Download Data (XLS File) |
|
|||||
|
|||||
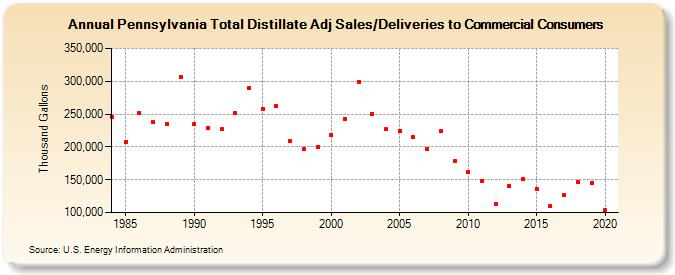
| Pennsylvania Total Distillate Adj Sales/Deliveries to Commercial Consumers (Thousand Gallons) | |||||
| Decade | Year-0 | Year-1 | Year-2 | Year-3 | Year-4 | Year-5 | Year-6 | Year-7 | Year-8 | Year-9 |
|---|---|---|---|---|---|---|---|---|---|---|
| 1980's | 245,576 | 207,646 | 252,099 | 237,251 | 234,527 | 306,381 | ||||
| 1990's | 234,137 | 228,824 | 227,263 | 251,856 | 290,053 | 257,826 | 262,220 | 208,269 | 196,727 | 200,585 |
| 2000's | 217,742 | 242,735 | 299,412 | 250,810 | 227,238 | 224,141 | 215,057 | 196,263 | 224,558 | 179,033 |
| 2010's | 161,857 | 148,693 | 112,603 | 140,207 | 151,510 | 136,581 | 109,617 | 126,263 | 146,049 | 144,802 |
| 2020's | 103,257 |
| - = No Data Reported; -- = Not Applicable; NA = Not Available; W = Withheld to avoid disclosure of individual company data. |
| Release Date: 2/9/2022 |
| Next Release Date: Suspended |