|
Download Data (XLS File) |
|
|||||
|
|||||
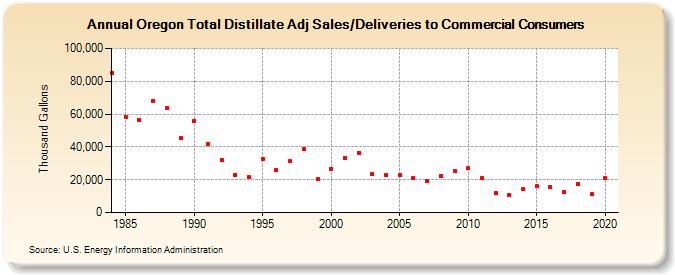
| Oregon Total Distillate Adj Sales/Deliveries to Commercial Consumers (Thousand Gallons) | |||||
| Decade | Year-0 | Year-1 | Year-2 | Year-3 | Year-4 | Year-5 | Year-6 | Year-7 | Year-8 | Year-9 |
|---|---|---|---|---|---|---|---|---|---|---|
| 1980's | 85,259 | 58,249 | 56,324 | 68,111 | 63,832 | 45,131 | ||||
| 1990's | 55,992 | 41,757 | 32,233 | 23,014 | 21,500 | 32,928 | 26,061 | 31,394 | 38,487 | 20,712 |
| 2000's | 26,819 | 33,519 | 36,531 | 23,638 | 22,739 | 22,652 | 21,267 | 18,945 | 22,468 | 25,374 |
| 2010's | 26,841 | 20,882 | 12,006 | 10,796 | 14,363 | 16,036 | 15,740 | 12,529 | 17,301 | 11,155 |
| 2020's | 20,880 |
| - = No Data Reported; -- = Not Applicable; NA = Not Available; W = Withheld to avoid disclosure of individual company data. |
| Release Date: 2/9/2022 |
| Next Release Date: Suspended |