|
Download Data (XLS File) |
|
|||||
|
|||||
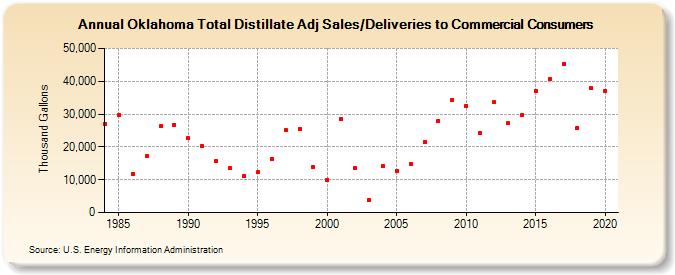
| Oklahoma Total Distillate Adj Sales/Deliveries to Commercial Consumers (Thousand Gallons) | |||||
| Decade | Year-0 | Year-1 | Year-2 | Year-3 | Year-4 | Year-5 | Year-6 | Year-7 | Year-8 | Year-9 |
|---|---|---|---|---|---|---|---|---|---|---|
| 1980's | 27,059 | 29,669 | 11,825 | 17,136 | 26,213 | 26,779 | ||||
| 1990's | 22,570 | 20,368 | 15,726 | 13,607 | 11,026 | 12,267 | 16,312 | 25,192 | 25,585 | 13,852 |
| 2000's | 9,955 | 28,581 | 13,467 | 3,781 | 14,078 | 12,749 | 14,903 | 21,455 | 27,960 | 34,402 |
| 2010's | 32,461 | 24,309 | 33,532 | 27,193 | 29,672 | 37,020 | 40,673 | 45,377 | 25,819 | 37,827 |
| 2020's | 37,094 |
| - = No Data Reported; -- = Not Applicable; NA = Not Available; W = Withheld to avoid disclosure of individual company data. |
| Release Date: 2/9/2022 |
| Next Release Date: Suspended |