|
Download Data (XLS File) |
|
|||||
|
|||||
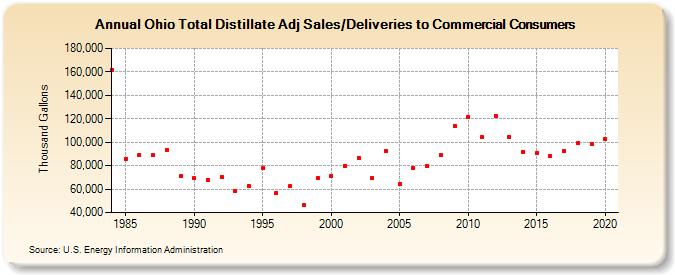
| Ohio Total Distillate Adj Sales/Deliveries to Commercial Consumers (Thousand Gallons) | |||||
| Decade | Year-0 | Year-1 | Year-2 | Year-3 | Year-4 | Year-5 | Year-6 | Year-7 | Year-8 | Year-9 |
|---|---|---|---|---|---|---|---|---|---|---|
| 1980's | 161,950 | 85,696 | 89,300 | 88,873 | 93,700 | 70,839 | ||||
| 1990's | 69,224 | 67,818 | 70,707 | 58,073 | 62,952 | 77,648 | 56,879 | 62,374 | 46,456 | 69,230 |
| 2000's | 71,453 | 80,130 | 86,863 | 69,826 | 92,691 | 64,348 | 78,370 | 80,101 | 89,019 | 114,006 |
| 2010's | 121,417 | 104,046 | 122,770 | 104,465 | 91,680 | 90,736 | 88,269 | 92,330 | 99,197 | 98,473 |
| 2020's | 102,707 |
| - = No Data Reported; -- = Not Applicable; NA = Not Available; W = Withheld to avoid disclosure of individual company data. |
| Release Date: 2/9/2022 |
| Next Release Date: Suspended |