|
Download Data (XLS File) |
|
|||||
|
|||||
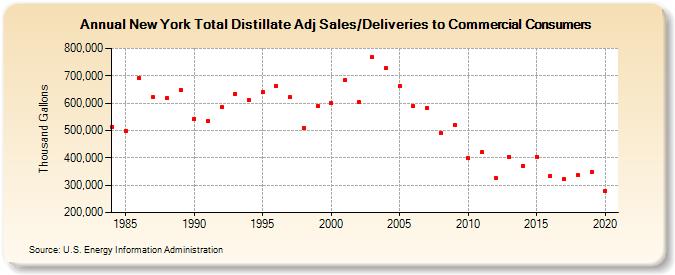
| New York Total Distillate Adj Sales/Deliveries to Commercial Consumers (Thousand Gallons) | |||||
| Decade | Year-0 | Year-1 | Year-2 | Year-3 | Year-4 | Year-5 | Year-6 | Year-7 | Year-8 | Year-9 |
|---|---|---|---|---|---|---|---|---|---|---|
| 1980's | 513,166 | 498,203 | 691,598 | 620,814 | 618,101 | 649,744 | ||||
| 1990's | 543,577 | 535,644 | 583,982 | 634,713 | 611,975 | 639,527 | 661,993 | 621,215 | 509,850 | 588,863 |
| 2000's | 599,393 | 682,961 | 603,789 | 768,146 | 727,721 | 661,930 | 588,343 | 582,660 | 490,614 | 519,086 |
| 2010's | 397,615 | 420,397 | 327,004 | 402,356 | 371,183 | 404,023 | 334,490 | 322,094 | 335,606 | 349,727 |
| 2020's | 279,114 |
| - = No Data Reported; -- = Not Applicable; NA = Not Available; W = Withheld to avoid disclosure of individual company data. |
| Release Date: 2/9/2022 |
| Next Release Date: Suspended |