|
Download Data (XLS File) |
|
|||||
|
|||||
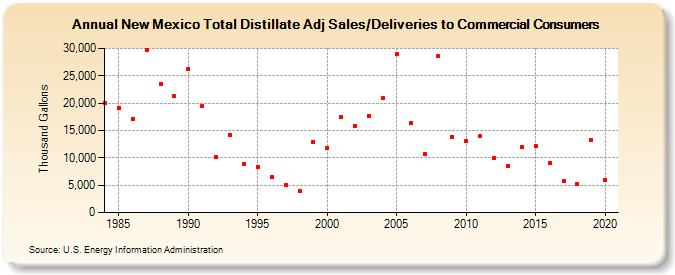
| New Mexico Total Distillate Adj Sales/Deliveries to Commercial Consumers (Thousand Gallons) | |||||
| Decade | Year-0 | Year-1 | Year-2 | Year-3 | Year-4 | Year-5 | Year-6 | Year-7 | Year-8 | Year-9 |
|---|---|---|---|---|---|---|---|---|---|---|
| 1980's | 20,047 | 19,023 | 17,035 | 29,700 | 23,573 | 21,249 | ||||
| 1990's | 26,261 | 19,402 | 10,109 | 14,243 | 8,880 | 8,415 | 6,483 | 5,059 | 3,984 | 12,949 |
| 2000's | 11,792 | 17,402 | 15,787 | 17,719 | 20,998 | 29,013 | 16,316 | 10,634 | 28,597 | 13,885 |
| 2010's | 13,002 | 13,904 | 10,044 | 8,488 | 11,956 | 12,127 | 9,083 | 5,703 | 5,196 | 13,256 |
| 2020's | 5,980 |
| - = No Data Reported; -- = Not Applicable; NA = Not Available; W = Withheld to avoid disclosure of individual company data. |
| Release Date: 2/9/2022 |
| Next Release Date: Suspended |