|
Download Data (XLS File) |
|
|||||
|
|||||
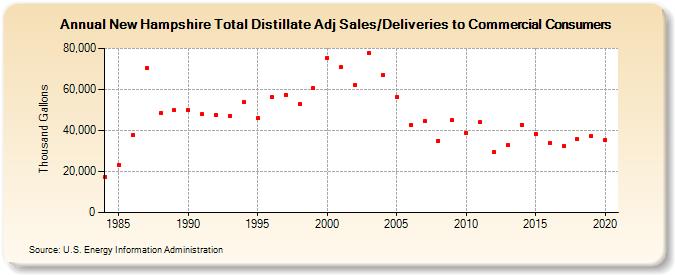
| New Hampshire Total Distillate Adj Sales/Deliveries to Commercial Consumers (Thousand Gallons) | |||||
| Decade | Year-0 | Year-1 | Year-2 | Year-3 | Year-4 | Year-5 | Year-6 | Year-7 | Year-8 | Year-9 |
|---|---|---|---|---|---|---|---|---|---|---|
| 1980's | 17,399 | 23,167 | 37,673 | 70,359 | 48,426 | 49,823 | ||||
| 1990's | 49,885 | 47,864 | 47,434 | 47,138 | 53,640 | 45,946 | 56,274 | 57,418 | 52,849 | 60,574 |
| 2000's | 75,419 | 70,688 | 62,137 | 77,976 | 67,090 | 56,284 | 42,755 | 44,375 | 35,066 | 44,942 |
| 2010's | 38,806 | 44,058 | 29,612 | 32,859 | 42,815 | 38,334 | 34,101 | 32,267 | 35,787 | 37,329 |
| 2020's | 35,434 |
| - = No Data Reported; -- = Not Applicable; NA = Not Available; W = Withheld to avoid disclosure of individual company data. |
| Release Date: 2/9/2022 |
| Next Release Date: Suspended |