|
Download Data (XLS File) |
|
|||||
|
|||||
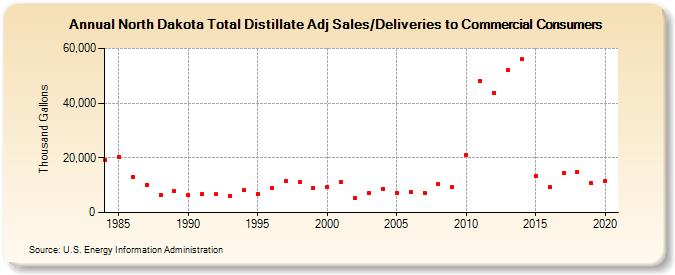
| North Dakota Total Distillate Adj Sales/Deliveries to Commercial Consumers (Thousand Gallons) | |||||
| Decade | Year-0 | Year-1 | Year-2 | Year-3 | Year-4 | Year-5 | Year-6 | Year-7 | Year-8 | Year-9 |
|---|---|---|---|---|---|---|---|---|---|---|
| 1980's | 19,142 | 20,365 | 13,168 | 10,166 | 6,467 | 7,804 | ||||
| 1990's | 6,321 | 6,705 | 6,613 | 6,009 | 8,065 | 6,723 | 8,881 | 11,443 | 11,122 | 8,944 |
| 2000's | 9,512 | 11,116 | 5,455 | 7,092 | 8,634 | 7,149 | 7,637 | 7,265 | 10,418 | 9,165 |
| 2010's | 20,999 | 47,962 | 43,870 | 52,041 | 55,951 | 13,541 | 9,344 | 14,420 | 14,641 | 10,641 |
| 2020's | 11,416 |
| - = No Data Reported; -- = Not Applicable; NA = Not Available; W = Withheld to avoid disclosure of individual company data. |
| Release Date: 2/9/2022 |
| Next Release Date: Suspended |