|
Download Data (XLS File) |
|
|||||
|
|||||
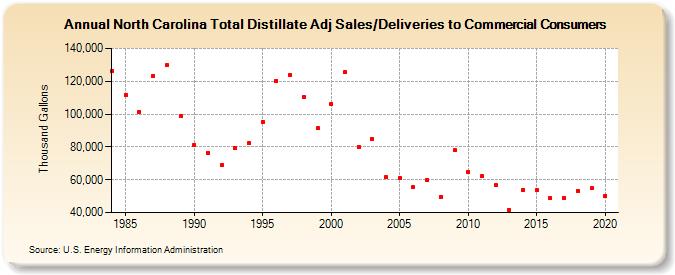
| North Carolina Total Distillate Adj Sales/Deliveries to Commercial Consumers (Thousand Gallons) | |||||
| Decade | Year-0 | Year-1 | Year-2 | Year-3 | Year-4 | Year-5 | Year-6 | Year-7 | Year-8 | Year-9 |
|---|---|---|---|---|---|---|---|---|---|---|
| 1980's | 126,149 | 111,519 | 101,547 | 123,234 | 129,619 | 98,741 | ||||
| 1990's | 81,192 | 76,468 | 68,883 | 79,165 | 82,147 | 95,456 | 120,367 | 123,977 | 110,584 | 91,267 |
| 2000's | 106,139 | 125,365 | 80,000 | 85,034 | 61,413 | 61,088 | 55,478 | 59,899 | 49,581 | 77,998 |
| 2010's | 64,727 | 62,045 | 56,630 | 41,763 | 54,013 | 53,736 | 48,850 | 48,775 | 53,258 | 54,751 |
| 2020's | 50,357 |
| - = No Data Reported; -- = Not Applicable; NA = Not Available; W = Withheld to avoid disclosure of individual company data. |
| Release Date: 2/9/2022 |
| Next Release Date: Suspended |