|
Download Data (XLS File) |
|
|||||
|
|||||
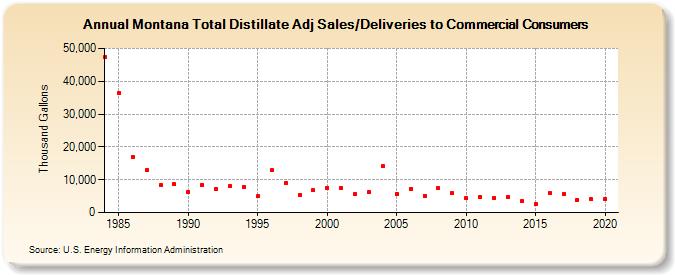
| Montana Total Distillate Adj Sales/Deliveries to Commercial Consumers (Thousand Gallons) | |||||
| Decade | Year-0 | Year-1 | Year-2 | Year-3 | Year-4 | Year-5 | Year-6 | Year-7 | Year-8 | Year-9 |
|---|---|---|---|---|---|---|---|---|---|---|
| 1980's | 47,321 | 36,309 | 16,926 | 12,817 | 8,361 | 8,558 | ||||
| 1990's | 6,390 | 8,545 | 7,111 | 8,143 | 7,933 | 4,963 | 12,947 | 9,031 | 5,454 | 6,776 |
| 2000's | 7,515 | 7,514 | 5,552 | 6,209 | 14,078 | 5,755 | 7,300 | 5,064 | 7,329 | 5,957 |
| 2010's | 4,348 | 4,831 | 4,515 | 4,788 | 3,399 | 2,511 | 5,892 | 5,655 | 3,961 | 3,993 |
| 2020's | 4,174 |
| - = No Data Reported; -- = Not Applicable; NA = Not Available; W = Withheld to avoid disclosure of individual company data. |
| Release Date: 2/9/2022 |
| Next Release Date: Suspended |