|
Download Data (XLS File) |
|
|||||
|
|||||
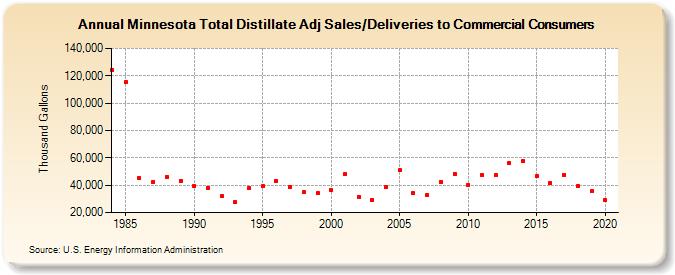
| Minnesota Total Distillate Adj Sales/Deliveries to Commercial Consumers (Thousand Gallons) | |||||
| Decade | Year-0 | Year-1 | Year-2 | Year-3 | Year-4 | Year-5 | Year-6 | Year-7 | Year-8 | Year-9 |
|---|---|---|---|---|---|---|---|---|---|---|
| 1980's | 124,024 | 115,367 | 45,223 | 42,344 | 46,264 | 43,396 | ||||
| 1990's | 39,359 | 38,214 | 31,914 | 27,402 | 37,883 | 39,150 | 43,179 | 38,852 | 34,828 | 33,977 |
| 2000's | 36,486 | 48,172 | 31,605 | 29,385 | 38,581 | 50,748 | 34,005 | 32,996 | 42,494 | 48,474 |
| 2010's | 40,310 | 47,493 | 47,196 | 56,335 | 57,463 | 46,654 | 41,603 | 47,745 | 39,550 | 35,536 |
| 2020's | 28,987 |
| - = No Data Reported; -- = Not Applicable; NA = Not Available; W = Withheld to avoid disclosure of individual company data. |
| Release Date: 2/9/2022 |
| Next Release Date: Suspended |