|
Download Data (XLS File) |
|
|||||
|
|||||
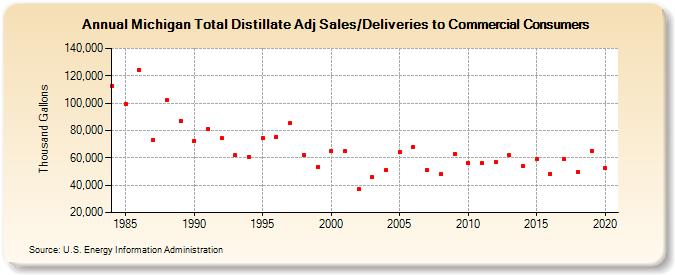
| Michigan Total Distillate Adj Sales/Deliveries to Commercial Consumers (Thousand Gallons) | |||||
| Decade | Year-0 | Year-1 | Year-2 | Year-3 | Year-4 | Year-5 | Year-6 | Year-7 | Year-8 | Year-9 |
|---|---|---|---|---|---|---|---|---|---|---|
| 1980's | 112,756 | 99,311 | 124,094 | 73,364 | 102,033 | 87,247 | ||||
| 1990's | 72,490 | 81,376 | 74,258 | 61,798 | 60,256 | 74,420 | 75,236 | 85,252 | 62,241 | 53,590 |
| 2000's | 64,746 | 64,798 | 37,206 | 45,781 | 50,989 | 64,175 | 68,282 | 51,197 | 48,075 | 62,969 |
| 2010's | 56,344 | 56,205 | 57,168 | 61,847 | 53,765 | 59,109 | 48,527 | 59,109 | 49,756 | 65,015 |
| 2020's | 52,432 |
| - = No Data Reported; -- = Not Applicable; NA = Not Available; W = Withheld to avoid disclosure of individual company data. |
| Release Date: 2/9/2022 |
| Next Release Date: Suspended |