|
Download Data (XLS File) |
|
|||||
|
|||||
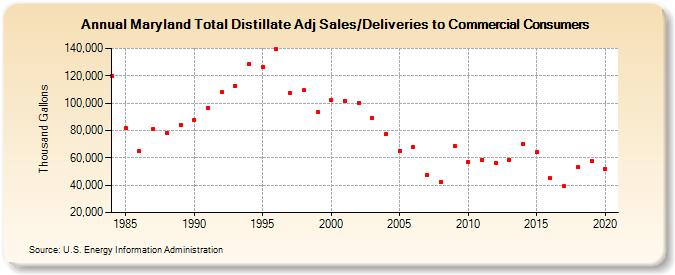
| Maryland Total Distillate Adj Sales/Deliveries to Commercial Consumers (Thousand Gallons) | |||||
| Decade | Year-0 | Year-1 | Year-2 | Year-3 | Year-4 | Year-5 | Year-6 | Year-7 | Year-8 | Year-9 |
|---|---|---|---|---|---|---|---|---|---|---|
| 1980's | 119,981 | 81,763 | 64,719 | 81,249 | 78,171 | 84,163 | ||||
| 1990's | 87,776 | 96,454 | 108,199 | 112,842 | 128,442 | 126,085 | 139,366 | 107,495 | 109,341 | 93,401 |
| 2000's | 102,290 | 101,764 | 100,367 | 89,304 | 77,068 | 65,315 | 67,935 | 47,411 | 42,424 | 68,529 |
| 2010's | 57,222 | 58,708 | 56,272 | 58,720 | 70,243 | 64,380 | 44,897 | 39,228 | 53,254 | 57,862 |
| 2020's | 51,971 |
| - = No Data Reported; -- = Not Applicable; NA = Not Available; W = Withheld to avoid disclosure of individual company data. |
| Release Date: 2/9/2022 |
| Next Release Date: Suspended |