|
Download Data (XLS File) |
|
|||||
|
|||||
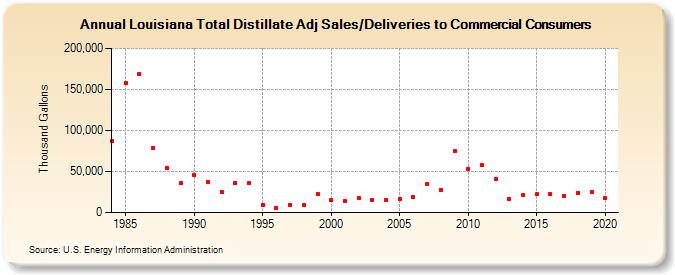
| Louisiana Total Distillate Adj Sales/Deliveries to Commercial Consumers (Thousand Gallons) | |||||
| Decade | Year-0 | Year-1 | Year-2 | Year-3 | Year-4 | Year-5 | Year-6 | Year-7 | Year-8 | Year-9 |
|---|---|---|---|---|---|---|---|---|---|---|
| 1980's | 87,148 | 157,560 | 169,154 | 78,948 | 54,428 | 35,497 | ||||
| 1990's | 45,696 | 37,727 | 25,445 | 36,300 | 36,295 | 8,947 | 4,958 | 9,322 | 8,723 | 22,562 |
| 2000's | 14,952 | 13,766 | 18,230 | 15,704 | 15,253 | 16,357 | 18,733 | 34,401 | 27,846 | 75,138 |
| 2010's | 53,324 | 57,385 | 40,461 | 16,385 | 20,920 | 22,255 | 22,478 | 20,575 | 24,246 | 24,991 |
| 2020's | 17,636 |
| - = No Data Reported; -- = Not Applicable; NA = Not Available; W = Withheld to avoid disclosure of individual company data. |
| Release Date: 2/9/2022 |
| Next Release Date: Suspended |