|
Download Data (XLS File) |
|
|||||
|
|||||
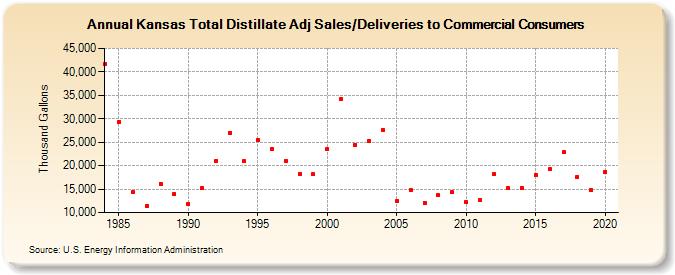
| Kansas Total Distillate Adj Sales/Deliveries to Commercial Consumers (Thousand Gallons) | |||||
| Decade | Year-0 | Year-1 | Year-2 | Year-3 | Year-4 | Year-5 | Year-6 | Year-7 | Year-8 | Year-9 |
|---|---|---|---|---|---|---|---|---|---|---|
| 1980's | 41,639 | 29,395 | 14,341 | 11,391 | 16,178 | 14,002 | ||||
| 1990's | 11,855 | 15,235 | 21,074 | 27,050 | 20,910 | 25,553 | 23,606 | 21,047 | 18,227 | 18,127 |
| 2000's | 23,449 | 34,277 | 24,472 | 25,325 | 27,643 | 12,385 | 14,828 | 12,095 | 13,697 | 14,315 |
| 2010's | 12,214 | 12,642 | 18,220 | 15,173 | 15,311 | 17,933 | 19,195 | 22,826 | 17,551 | 14,798 |
| 2020's | 18,752 |
| - = No Data Reported; -- = Not Applicable; NA = Not Available; W = Withheld to avoid disclosure of individual company data. |
| Release Date: 2/9/2022 |
| Next Release Date: Suspended |