|
Download Data (XLS File) |
|
|||||
|
|||||
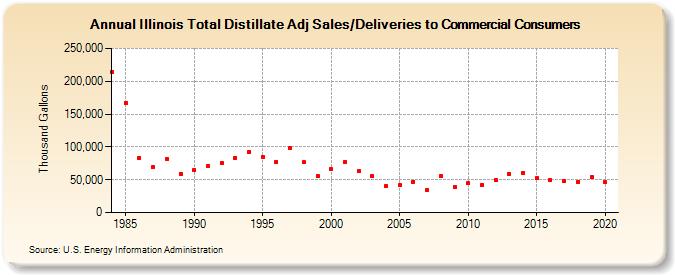
| Illinois Total Distillate Adj Sales/Deliveries to Commercial Consumers (Thousand Gallons) | |||||
| Decade | Year-0 | Year-1 | Year-2 | Year-3 | Year-4 | Year-5 | Year-6 | Year-7 | Year-8 | Year-9 |
|---|---|---|---|---|---|---|---|---|---|---|
| 1980's | 213,906 | 167,325 | 83,345 | 69,207 | 82,151 | 59,185 | ||||
| 1990's | 64,864 | 70,934 | 75,688 | 83,666 | 92,873 | 84,979 | 77,447 | 98,086 | 76,959 | 56,060 |
| 2000's | 65,789 | 77,140 | 63,164 | 55,322 | 40,162 | 42,201 | 47,137 | 33,739 | 55,838 | 39,402 |
| 2010's | 44,442 | 42,421 | 49,226 | 59,328 | 60,966 | 52,848 | 49,367 | 47,300 | 47,170 | 54,503 |
| 2020's | 46,390 |
| - = No Data Reported; -- = Not Applicable; NA = Not Available; W = Withheld to avoid disclosure of individual company data. |
| Release Date: 2/9/2022 |
| Next Release Date: Suspended |