|
Download Data (XLS File) |
|
|||||
|
|||||
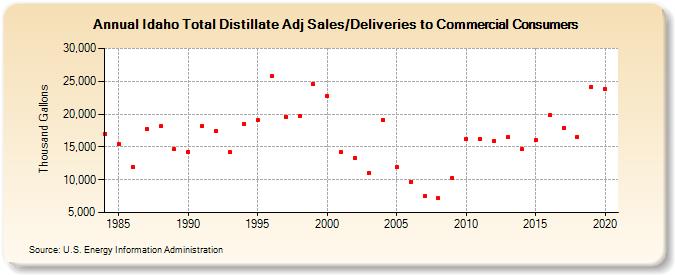
| Idaho Total Distillate Adj Sales/Deliveries to Commercial Consumers (Thousand Gallons) | |||||
| Decade | Year-0 | Year-1 | Year-2 | Year-3 | Year-4 | Year-5 | Year-6 | Year-7 | Year-8 | Year-9 |
|---|---|---|---|---|---|---|---|---|---|---|
| 1980's | 17,024 | 15,407 | 11,969 | 17,741 | 18,114 | 14,624 | ||||
| 1990's | 14,262 | 18,211 | 17,412 | 14,213 | 18,512 | 19,082 | 25,733 | 19,600 | 19,720 | 24,578 |
| 2000's | 22,766 | 14,194 | 13,273 | 11,007 | 19,160 | 11,862 | 9,699 | 7,455 | 7,167 | 10,250 |
| 2010's | 16,243 | 16,179 | 15,883 | 16,502 | 14,619 | 15,974 | 19,783 | 17,934 | 16,475 | 24,162 |
| 2020's | 23,782 |
| - = No Data Reported; -- = Not Applicable; NA = Not Available; W = Withheld to avoid disclosure of individual company data. |
| Release Date: 2/9/2022 |
| Next Release Date: Suspended |